
Manage Your Data More Efficiently With These Six 4Industry Manufacturing Dashboards
Manufacturing dashboards display KPIs and other production metrics in meaningful ways to improve operational speed, efficiency and uptime.
If you can’t see it, you can’t fix it. That’s why online dashboards are increasingly becoming a necessary tool for any manufacturer interested in continuous improvement. Manufacturing dashboards display key performance indicators (KPIs) and other production metrics in interactive, meaningful ways, enabling manufacturers to improve the speed, efficiency and uptime of their operation.
While it’s true many manufacturers do track KPIs, these processes often take the form of pen and paper, Excel spreadsheets, Enterprise Resource Planning (ERP) systems, Manufacturing Execution Systems (MES) or some combination of all four.
The best way to truly manage performance data more efficiently is to roll everything up into one centralized place. For example, the 4Industry platform offers users several manufacturing dashboard options that provide greater visibility into formerly siloed processes, including deviations, safety and health issues, job management and more.
Let’s take a closer look at these six dashboards, including the ways they focus on continuous improvement on the shop floor.
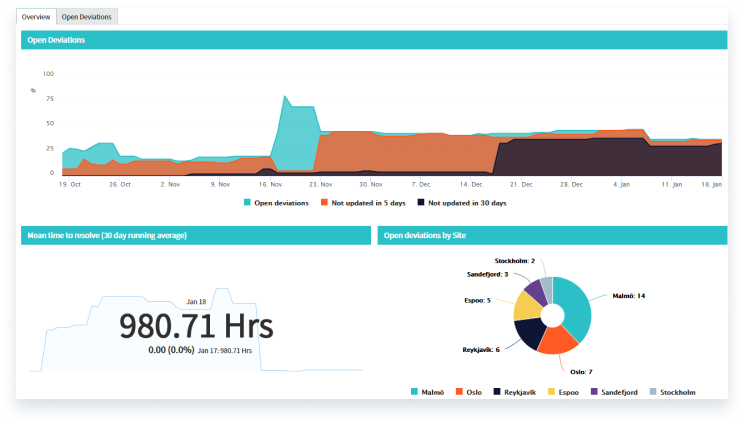
Deviations
These dashboards display critical information related to registered deviations — from the number of open issues, to mean time to closure. They can also display a timeline of all open issues, breaking down each deviation in terms of when it was last updated.
Thanks to these features, deviation dashboards enable manufacturers to track the status of open issues and also shed light on how they can improve the deviation management process. These dashboards can even aggregate open deviations across multiple plant locations.
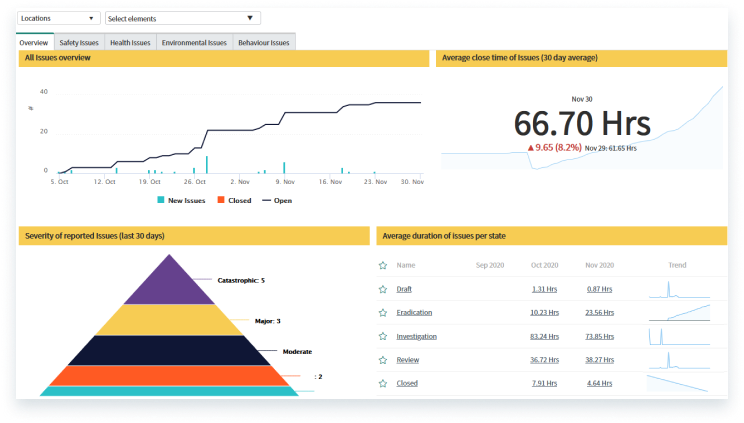
Environment, Health and Safety (EHS)
In any manufacturing environment, it’s important to resolve safety issues as quickly as possible to avoid equipment damage, downtime or personnel injury. EHS dashboards roll up and display information related to these incidents, including:
- An overview of new, open and closed issues
- A 30-day breakdown of issue severity
- The average close time of EHS issues
- The average duration of issues per state — whether draft, investigation, eradication, etc.
In many cases, these metrics are difficult, if not impossible, to track without digital tools. At the same time, you may be required to track them to ensure certain safety and regulatory compliances.
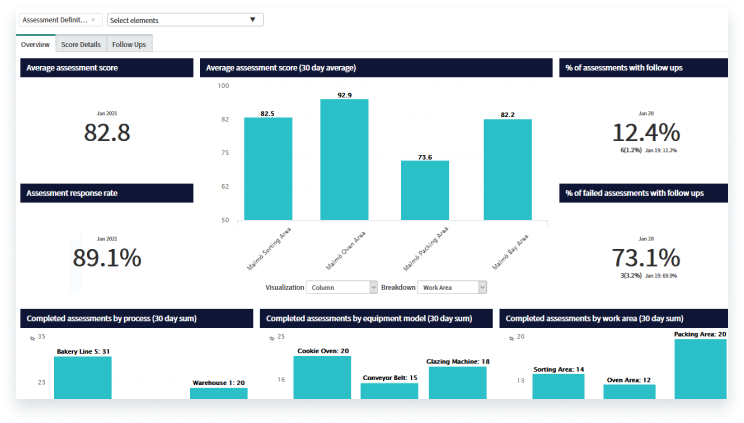
Assessment Management
Assessment management dashboards — much like audits — ensure equipment, personnel and processes are proceeding as they should. These dashboards enable manufacturers to track things like quality and cleanliness. They also display data related to average assessment scores, response rates and required follow-up. Users can even trigger assessments from other areas of the 4Industry software, including the deviation management and EHS dashboards.
Job Management
This manufacturing dashboard displays jobs that don’t require dedicated staff or engineers. In other words, it breaks down tasks — Clean, Inspect and Lubricate (CIL) tasks, for example — that workers can perform while standing at their machine. Supervisors can create or assign jobs to individuals within the 4Industry app, supply on-demand knowledge and create step-by-step work instructions. With this information, an operator has all the information he or she needs to complete the task.
Without a digital tool in place, these ad hoc activities are often difficult to track and are prone to being siloed. With a digital dashboard, however, you can communicate relevant job information to anyone who needs it.
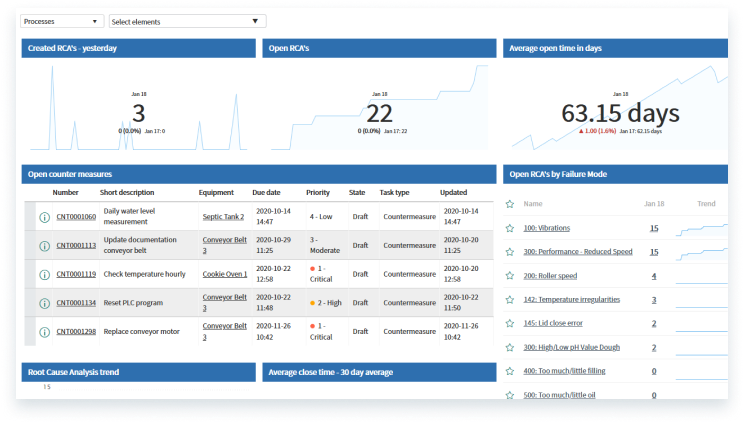
Root Cause Analysis
4Industry manufacturing dashboards don’t just display open deviations; they also break down in-progress Root Cause Analysis (RCA) processes. RCA is an online tool that enables users to collaborate remotely with colleagues, vendors and other stakeholders to find the root cause of a deviation or equipment breakdown. Using the RCA dashboard, manufacturers can take these workflows a step further by viewing metrics like:
- The number of open RCAs
- Open counter measures
- Average open and close times
- Open RCA by failure more — whether vibration, speed, temperature irregularity, etc.
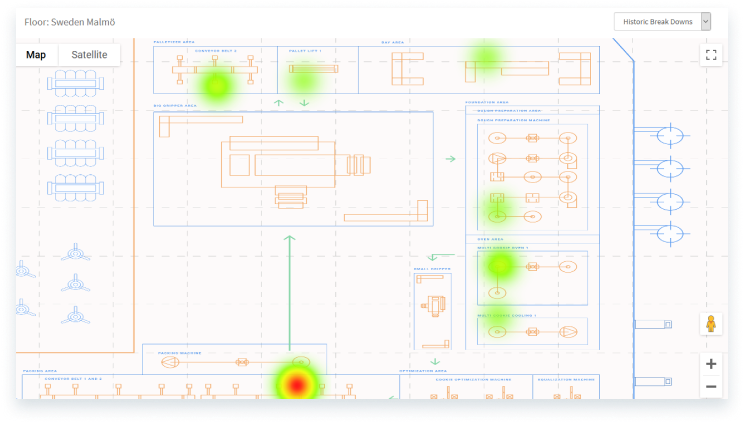
Floor Visualization
In addition to dashboards, the 4Industry app can display an interactive map of your shop floor, including active deviations and open jobs. This tool can even represent data as heat maps. To get started, simply upload a map of your factory floor and input the coordinates for specific equipment. These floor visualizations are also a helpful way to gather and display information across multiple plants.
The 4Industry Connector Solution
These manufacturing dashboards are just the beginning. We also have the ability to connect our 4Industry platform to external data sources, enabling you to transfer any relevant data into the 4Industry app. Thanks to this solution, you can display data from your external source as dashboards, achieving new insights and driving new action within our application.